The making of data driven stories
- Process
- Where to get the data from
- How to clean your data
- Data analysis
- Data Visualisation
- Tutorial 1
- Tutorial 2
- Tutorial 3
- Tutorial 4
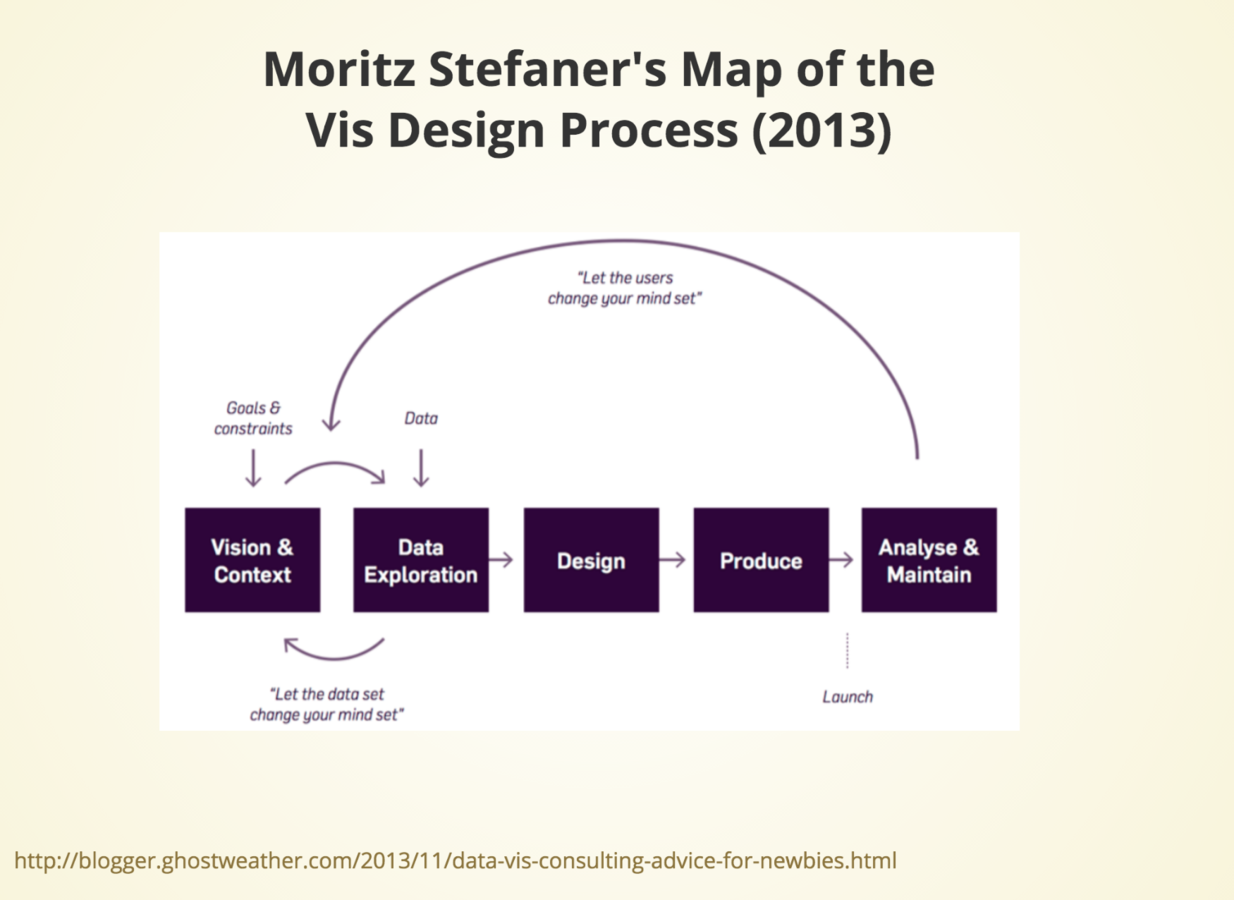
Process
Moritz Stefaner: Process of Data Visualisation
1. Where to get the data from?
- Open data portals
- Organisations
- Data scraping
- personal data (first hand collection)
Scraping
- Kimono
- ScraperWiki
- Python
Investigative Reporting:
correctiv.org
-
The process for investigative data journalism David Schraven’s organisation follows includes three major steps.
“First of all we try to find out how to create a visualisation from it. We try to find a story in the big data sets, the key points, and what is important about all this data.
"Once we found the story, we try to find human beings who can talk about it and who have been affected by the issue we found,” he explained.
2. Cleaning Data:
- Tutorial page
3. Analysis:
- Tutorial page
Big Data
-
Don't be afraid of big data sets!
(start querying big data and make it small) -
"There's no need to load the data, create and maintain schemas, or transform the data before it can be processed. Instead, simply include the path to a Hadoop directory, MongoDB collection or S3 bucket in the SQL query."
4. Data Visualisation:
Start wide, end narrow
- Tutorial page
- Exploratory vs Explanatory Data Visualisations
- Ben Shneiderman
- New UI components to present data stories on the web
- Simplicity in vogue
Exploratory vs Explanatory Data Visualisations
Exploratory
- Excel, Python, R / Shiny, Tableau, SAS/SPSS
Explanatory
- Illustrator, Javascript / D3.js, R (ggplot2), Tableau, Jupyter / IPython notebook
Ben Shneiderman
Ben Shneiderman’s
Infovis 1996 mantra:
"Overview First, Zoom and filter, then detail on demand..."
UI Storytelling on the web
Personalisation
Why/Why "not" to use data from...
IOT/Personal devices
The Stepper
Tutorial
UI: Scroller
- Scoll.js
- ScollMagic.js
- Bloomberg
- NYT
Filtering
Stories
Zoooooooming
Data Dashboards
Simulation:
Thank you
@BenHeubl